How to Automate Agency Reporting (Without Hiring Another Person)
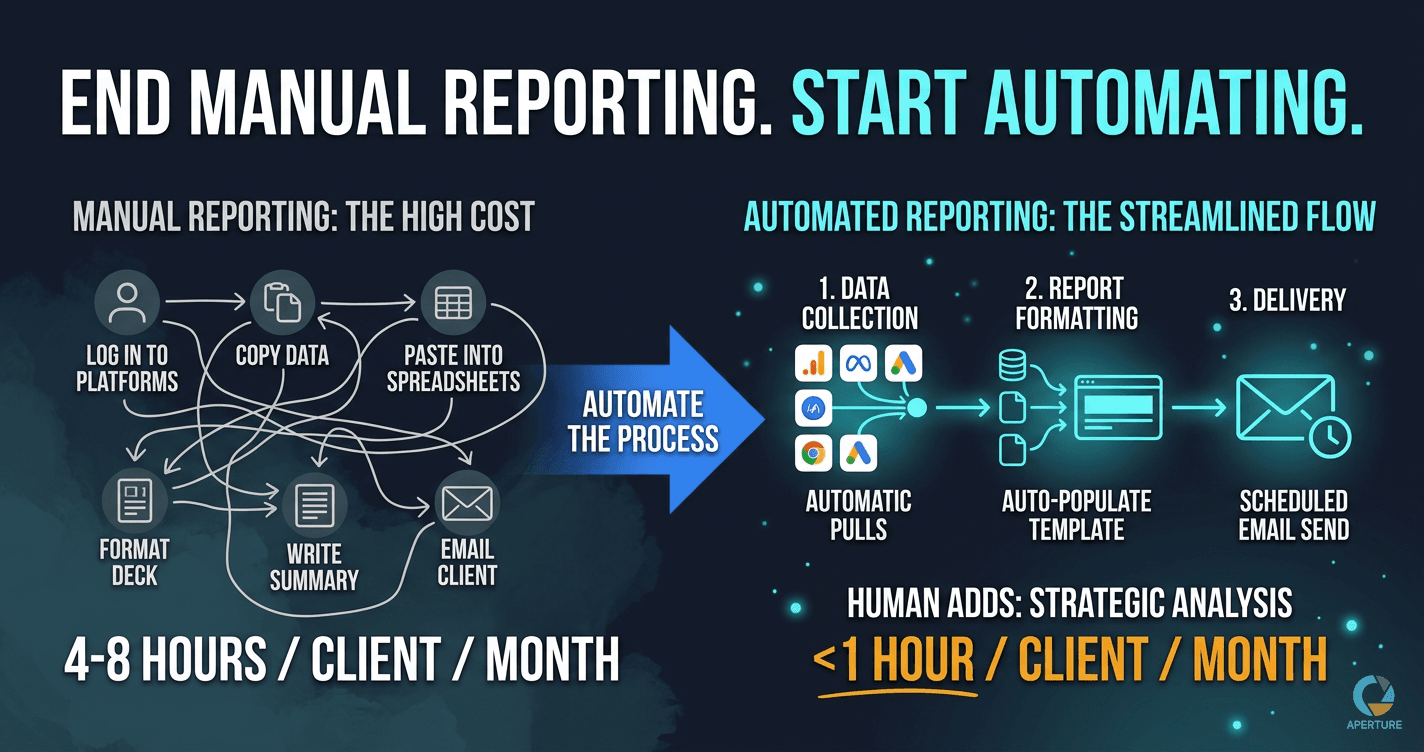
Agency reporting is one of the highest-volume repetitive processes in client services. It runs every month, for every client, without exception. And for most agencies, it runs manually: log into each platform, pull the numbers, paste them into a spreadsheet, format a slide deck, write the summary, email it to the client.
At five clients, that's manageable. At twenty clients, it's a part-time job that nobody budgeted for.
What Does Manual Reporting Actually Cost?
The calculation most agency operators haven't done: multiply the number of clients by the average hours per client per month for reporting.
For most agencies, manual reporting takes four to eight hours per client per month. That's not always visible because the work is distributed and blends into the normal workload. The account manager spends two hours pulling data. The strategist spends an hour writing commentary. Someone else formats the deck. The delivery gets delayed because the person responsible for one piece was tied up on another account.
At ten clients, you're looking at forty to eighty hours monthly. At twenty clients, you've created a full-time reporting role that nobody officially holds but everyone unofficially shares.
Run this calculation for your agency. The number is almost always higher than expected.
What Can Actually Be Automated?
The reporting workflow has three phases: data collection, report formatting, and delivery. Each has different automation potential.
Data collection: fully automatable. Pulling metrics from Google Ads, Meta, GA4, Google Search Console, LinkedIn, and other platforms is mechanical and rule-based. Tools like Looker Studio, AgencyAnalytics, and Zapier-connected Google Sheets can pull this data automatically on a schedule. No one needs to log into a platform and copy numbers.
Report formatting: mostly automatable. A template-based report that pulls from connected data sources populates automatically. The data changes each month. The structure doesn't. If you've built one Looker Studio dashboard or one Sheets-based template that connects to your data sources, it updates without anyone touching it.
Delivery: fully automatable. Scheduling and sending reports on a defined cadence is a simple automation: on the first business day of each month, send this report to this client email via this template. No manual trigger required.
What stays manual: Strategic commentary. Performance interpretation. Conversations about what the numbers mean and what changes based on them. These require judgment and client context that an automated system doesn't have. Keep the human layer where it adds genuine value: analysis and strategy, not data formatting.
How to Build the Reporting Automation
The build starts with the map, as every automation does. Before touching a tool, document your current reporting process exactly as it exists:
- What data sources does each report pull from?
- Who currently pulls each data source?
- How is the data formatted and combined?
- What template does the report follow?
- Who writes the commentary section?
- Who approves the report before it goes out?
- How is it delivered to the client and on what schedule?
Every step that follows a rule and doesn't require judgment is an automation candidate. Every step that requires someone to interpret and decide stays human.
With the map complete, the build sequence is:
- Connect data sources to a consolidation layer (Google Sheets or a reporting platform like AgencyAnalytics)
- Build the report template that pulls from the consolidation layer
- Validate that the data flows correctly for two or three client reports
- Build the delivery automation (Zapier triggers report email on a monthly schedule)
- Add human review step for commentary before automated delivery, or after if your process allows
The first time you run this, it will take longer than it looks. Data sources have quirks. Templates need adjustment. Delivery schedules need testing. Plan for a week to get the first full version working cleanly.
What I Learned Running Reporting at Scale
When I was managing paid advertising campaigns for 50+ companies simultaneously at 180Fusion early in my career, the only way I survived was systems. Not talent. Systems.
You cannot track the performance of 50 accounts in your head. You cannot write coherent updates for 50 clients without a process. Every account needs to be measured against the same criteria so you can identify the ones that need attention without auditing every single one every week.
I built reporting templates not because I was told to, but because the volume made them necessary. The templates meant I wasn't starting from scratch for each account. The data pulled in the same way. The structure was consistent. The only thing that varied was the analysis, which was the part that actually required my attention.
Later, running my own agency with the BEST Framework, the same principle applied at a different scale. Our cost per lead decreased 30% within 30 days of systematizing our processes, partly because reporting was consistent enough that we could see what was actually working. You cannot optimize what you cannot see. Automated, consistent reporting is what makes the data visible.
What Tools Do Agencies Actually Use?
For reporting dashboards: Google Looker Studio (free, connects to most major platforms), AgencyAnalytics, Databox, DashThis. The right choice depends on how many clients you have and how much customization you need per client.
For data consolidation: Google Sheets with API connectors or Zapier. A Sheets-based consolidation layer gives you flexibility and keeps the data in a format you can manipulate.
For delivery automation: Zapier, Make, or the built-in scheduling in your reporting platform. The trigger is a calendar event. The action is sending the report PDF or sharing the dashboard link.
For the commentary layer: Many agencies use a simple Google Doc template that the account manager fills in monthly. The doc covers the strategic interpretation that automated data doesn't provide. The account manager's job becomes: review the auto-populated report, add the commentary doc, confirm delivery. One to two hours per client instead of four to eight.
What Makes Reporting Automation Fail?
Two common failure modes.
Too much customization per client. If every client requires a completely different report format, automation becomes difficult. The fix is standardizing on a core template that works for 80% of clients. Outliers get a variation, not a one-off. Treat customization as the exception.
No defined delivery standard. Automated reporting that goes out on "the first of the month" fails when the first is a weekend and nobody confirmed what happens then. Automated reporting that requires someone to approve before sending fails when the approver is on vacation. Define the delivery standard explicitly in the process map before building.
Both of these are process problems, not tool problems. The map catches them before they become live failures.
How This Fits the Broader Agency Operations Stack
Reporting automation is typically the third or fourth automation an agency builds. The first is usually client onboarding. The second is often lead follow-up. Reporting is the monthly recurring work that, once automated, frees the most ongoing hours.
Together, these three automations cover the full client lifecycle: lead captured and followed up, client onboarded, performance reported monthly. The entire account management workflow runs with minimal manual intervention at each stage.
The starting point is the same for all three: map the process before building anything. Reporting automation built from a complete map works the first time. Reporting automation built from a guess runs for two months and then breaks when something changes in the data source.
Start a conversation with Steve at Aperture OS → to map your reporting workflow and build the automation that ends manual reporting for good.
Evan Van Dyke is the founder of Aperture OS. He spent seven years running a marketing agency, scaling 100+ businesses, eventually systemizing it to three hours a week, and sold it in 2021. He now builds AI automation systems for business owners. About Evan →
Frequently Asked Questions
Q: How much time does manual agency reporting actually take? Four to eight hours per client per month. At ten clients, that is 40 to 80 hours monthly. At twenty clients, it is a full-time role that nobody officially holds. The hours are not always visible because the work is distributed, but when you calculate it explicitly, the number is almost always higher than expected.
Q: What parts of agency reporting can be automated? Data collection from ad and analytics platforms, template-based report formatting, and scheduled delivery are all fully automatable. Strategic commentary and performance interpretation require human judgment and should stay manual. Build automation around the mechanical work and preserve human time for the analysis clients actually value.
Q: What tools do agencies use to automate client reporting? Google Looker Studio for live data-connected dashboards, Google Sheets for data consolidation, and Zapier or Make for delivery automation. Dedicated platforms like AgencyAnalytics or DashThis work well at higher volume. The right tool depends on client count, data source complexity, and how much per-client customization is required.
Q: Do I need a custom report for every client? No. Build one core template that covers 80% of clients, then maintain a small set of variations. The goal is a standard structure that populates automatically, requires minimal customization, and delivers on a defined schedule. Treat one-off customization as the exception, not the rule.
Q: How does automating reporting affect client relationships? Done well, it improves them. Reports arrive on time every time. Data is consistent and accurately formatted. The time saved on mechanical work gets reinvested in analysis and strategy, which is what clients actually pay for. The risk is reporting that feels impersonal. The solution is keeping the commentary and interpretation layer human on top of the automated data foundation. See how Aperture OS builds this →